Comparison guide
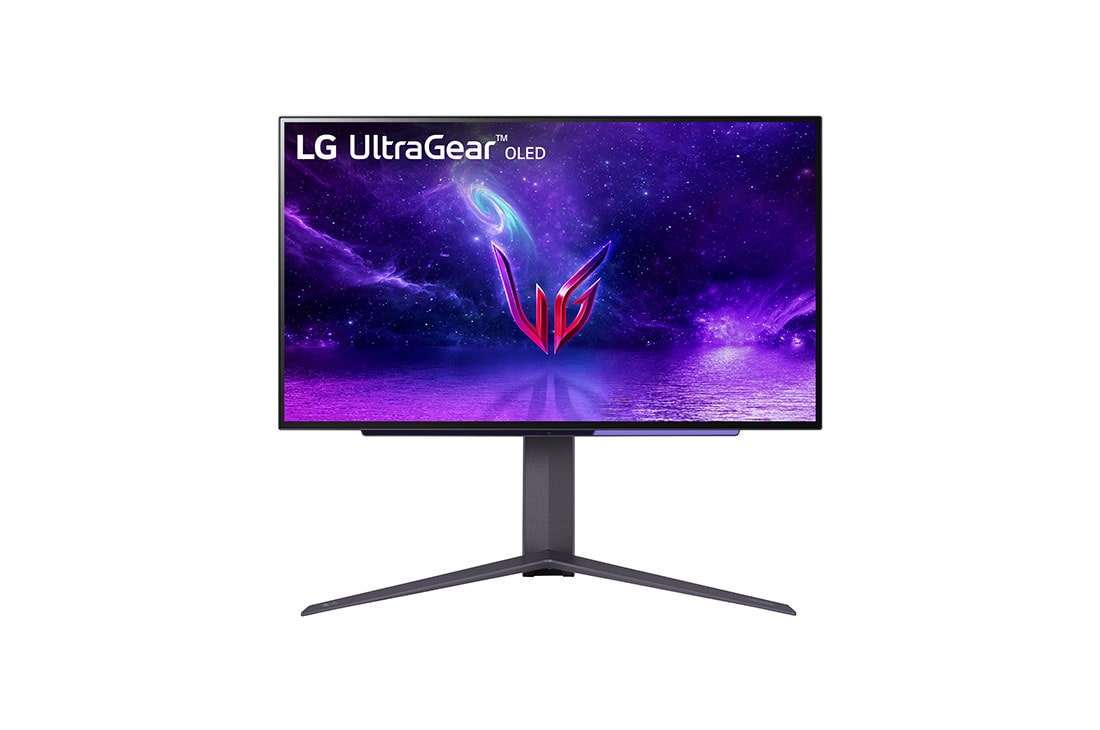
LG UltraGear OLED 27GR95QE-B vs ASUS ROG Strix XG27AQDMG: which should you choose?
LG UltraGear OLED 27GR95QE-B and ASUS ROG Strix XG27AQDMG compared under one framework. Decision axes: resolution and text clarity, panel quality, refresh rate, color accuracy, brightness, and connectivity. Includes price context and category-specific tradeoffs.
Published: 2026-08-16
Monitors verdict
Upgrade for specific needs. The products share a category but prioritize different strengths. The figures below use the same weighting model and stored representative configurations; confirm the configuration and price on the merchant page before buying.
- LG UltraGear OLED 27GR95QE-B: A 27-inch QHD OLED 240Hz — a 0.03ms response and perfect blacks, all in for fast games.
- ASUS ROG Strix XG27AQDMG: A 27-inch QHD WOLED 240Hz value pick — a glossy/matte coating choice to suit your room.
- Upgrade recommendation: 53 / 100
- Data completeness: 100%
Choosing between LG UltraGear OLED 27GR95QE-B and ASUS ROG Strix XG27AQDMG starts with the real use case and the problem to solve, not with which product is newer. Use context: the longest screen task across documents, photo or video editing, PC gaming, and consoles. Decision axes: resolution and text clarity, panel quality, refresh rate, color accuracy, brightness, and connectivity. This guide applies one calculation model to stored representative configurations while keeping the category-specific decision order visible.
Core specifications on one baseline
| Item | LG UltraGear OLED 27GR95QE-B | ASUS ROG Strix XG27AQDMG | Delta |
|---|---|---|---|
| Resolution | 78 score | 78 score | Same |
| Panel quality | 96 score | 96 score | Same |
| Refresh rate | 96 score | 96 score | Same |
| Color gamut | 92 score | 92 score | Same |
| Brightness | 62 score | 62 score | Same |
| Connectivity | 78 score | 84 score | +7.7% |
| Value | 78 score | 84 score | +7.7% |
| Screen size | 26.5 in | 26.5 in | Same |
| refresh_hz | 240 Hz | 240 Hz | Same |
| peak_nits | 1000 nits | 1000 nits | Same |
| response_ms | 0.03 ms | 0.03 ms | Same |
| dci_p3_pct | 98.5 % | 99 % | +0.5% |
| Chipset | WOLED panel | WOLED panel | Same |
| Color | Black | Black | Same |
| Connectivity | 2x HDMI 2.1, DP 1.4, USB 3.0 hub | 2x HDMI 2.1, DP 1.4, USB-C DP Alt, USB hub | Different |
| HDR | VESA DisplayHDR True Black 400 | VESA DisplayHDR True Black 400 | Same |
| Lineup | UltraGear | ROG Monitor | Different |
| Panel type | WOLED | WOLED | Same |
| Region | GLOBAL | GLOBAL | Same |
| Resolution | 2560x1440 (QHD) | 2560x1440 (QHD) | Same |
Resolution
The resolution score is 78.0 for LG UltraGear OLED 27GR95QE-B and 78.0 for ASUS ROG Strix XG27AQDMG. The two products are level here. It is a relative index combining pixel density and text or workspace clarity at the given size on one baseline. Read the underlying specification rows, source completeness, and exact selling configuration before treating the lead as decisive. Similar averages can hide different weak points, so a small point gap matters less than whether the product removes a concrete problem under your normal usage conditions.
Panel quality
The panel quality score is 96.0 for LG UltraGear OLED 27GR95QE-B and 96.0 for ASUS ROG Strix XG27AQDMG. The two products are level here. It is a relative index combining contrast, viewing angles, response behavior, burn-in, and persistence risk on one baseline. Read the underlying specification rows, source completeness, and exact selling configuration before treating the lead as decisive. Similar averages can hide different weak points, so a small point gap matters less than whether the product removes a concrete problem under your normal usage conditions.
Refresh rate
The refresh rate score is 96.0 for LG UltraGear OLED 27GR95QE-B and 96.0 for ASUS ROG Strix XG27AQDMG. The two products are level here. It is a relative index combining motion clarity and input latency in games and scrolling on one baseline. Read the underlying specification rows, source completeness, and exact selling configuration before treating the lead as decisive. Similar averages can hide different weak points, so a small point gap matters less than whether the product removes a concrete problem under your normal usage conditions.
Color gamut
The color gamut score is 92.0 for LG UltraGear OLED 27GR95QE-B and 92.0 for ASUS ROG Strix XG27AQDMG. The two products are level here. It is a relative index combining color coverage and calibration suitability for photo and video work on one baseline. Read the underlying specification rows, source completeness, and exact selling configuration before treating the lead as decisive. Similar averages can hide different weak points, so a small point gap matters less than whether the product removes a concrete problem under your normal usage conditions.
Brightness
The brightness score is 62.0 for LG UltraGear OLED 27GR95QE-B and 62.0 for ASUS ROG Strix XG27AQDMG. The two products are level here. It is a relative index combining bright-room readability, SDR headroom, and HDR highlights on one baseline. Read the underlying specification rows, source completeness, and exact selling configuration before treating the lead as decisive. Similar averages can hide different weak points, so a small point gap matters less than whether the product removes a concrete problem under your normal usage conditions.
Connectivity
The connectivity score is 78.0 for LG UltraGear OLED 27GR95QE-B and 84.0 for ASUS ROG Strix XG27AQDMG. ASUS ROG Strix XG27AQDMG leads this dimension. It is a relative index combining single-cable laptops, power delivery, KVM use, and console compatibility on one baseline. Read the underlying specification rows, source completeness, and exact selling configuration before treating the lead as decisive. Similar averages can hide different weak points, so a small point gap matters less than whether the product removes a concrete problem under your normal usage conditions.
Value
The value score is 78.0 for LG UltraGear OLED 27GR95QE-B and 84.0 for ASUS ROG Strix XG27AQDMG. ASUS ROG Strix XG27AQDMG leads this dimension. It is a relative index combining panel, resolution, ports, and warranty relative to the current price on one baseline. Read the underlying specification rows, source completeness, and exact selling configuration before treating the lead as decisive. Similar averages can hide different weak points, so a small point gap matters less than whether the product removes a concrete problem under your normal usage conditions.
Who should choose LG UltraGear OLED 27GR95QE-B
LG UltraGear OLED 27GR95QE-B is the stronger fit when its leading dimensions match your primary use. Configuration checks: screen size, resolution, panel, refresh rate, brightness, color gamut, inputs, and power delivery. Then ask whether the product removes a concrete problem with the device you already own. If the gap is small and there is no real pain point, waiting for a price drop or a change in workload can be more rational than upgrading for novelty alone.
Who should choose ASUS ROG Strix XG27AQDMG
ASUS ROG Strix XG27AQDMG is the better fit when more of its strengths overlap your priorities and its weaker dimensions remain acceptable. Switching costs: monitor arm and desk space, cables and docks, KVM setup, warranty, and burn-in policy. A higher total can still deliver lower practical value when that burden is large, so compare the score lead and switching cost on the same baseline.
How to read price and purchase availability
Neither product currently has an approved purchase link whose product name and configuration match the catalog, so no merchant link is shown. AsKrs does not guess a destination; this guide provides specifications and decision criteria until an exact listing is verified.
- LG UltraGear OLED 27GR95QE-B · No verified purchase link currently available
- ASUS ROG Strix XG27AQDMG · No verified purchase link currently available
Final decision checklist
- Use context: the longest screen task across documents, photo or video editing, PC gaming, and consoles.
- Configuration checks: screen size, resolution, panel, refresh rate, brightness, color gamut, inputs, and power delivery.
- Switching costs: monitor arm and desk space, cables and docks, KVM setup, warranty, and burn-in policy.
- When the score gap is small, identify the concrete problem the change will solve.
- Recheck the seller, delivery, return terms, condition, and current price at checkout.
Scope and limits of this comparison
This comparison is a structured decision aid built from published specifications and stored representative configurations. Scope and limits: panel variance, OLED burn-in risk, real HDR brightness, desk distance, and operating-system scaling. The scores are relative indicators for setting priorities within one category, not an absolute quality ranking. When a new configuration or verified specification becomes available, the catalog and its comparison pages are regenerated together.
Open the full configuration-level comparison and upgrade score